COUNTRY DATA — NEWZEALAND
Data Visualisation & Mapping
Country Analytics
Duration / 3 Weeks
Mentor / RISD Graphic Design, Doug Scott
Tools / Adobe Illustrator
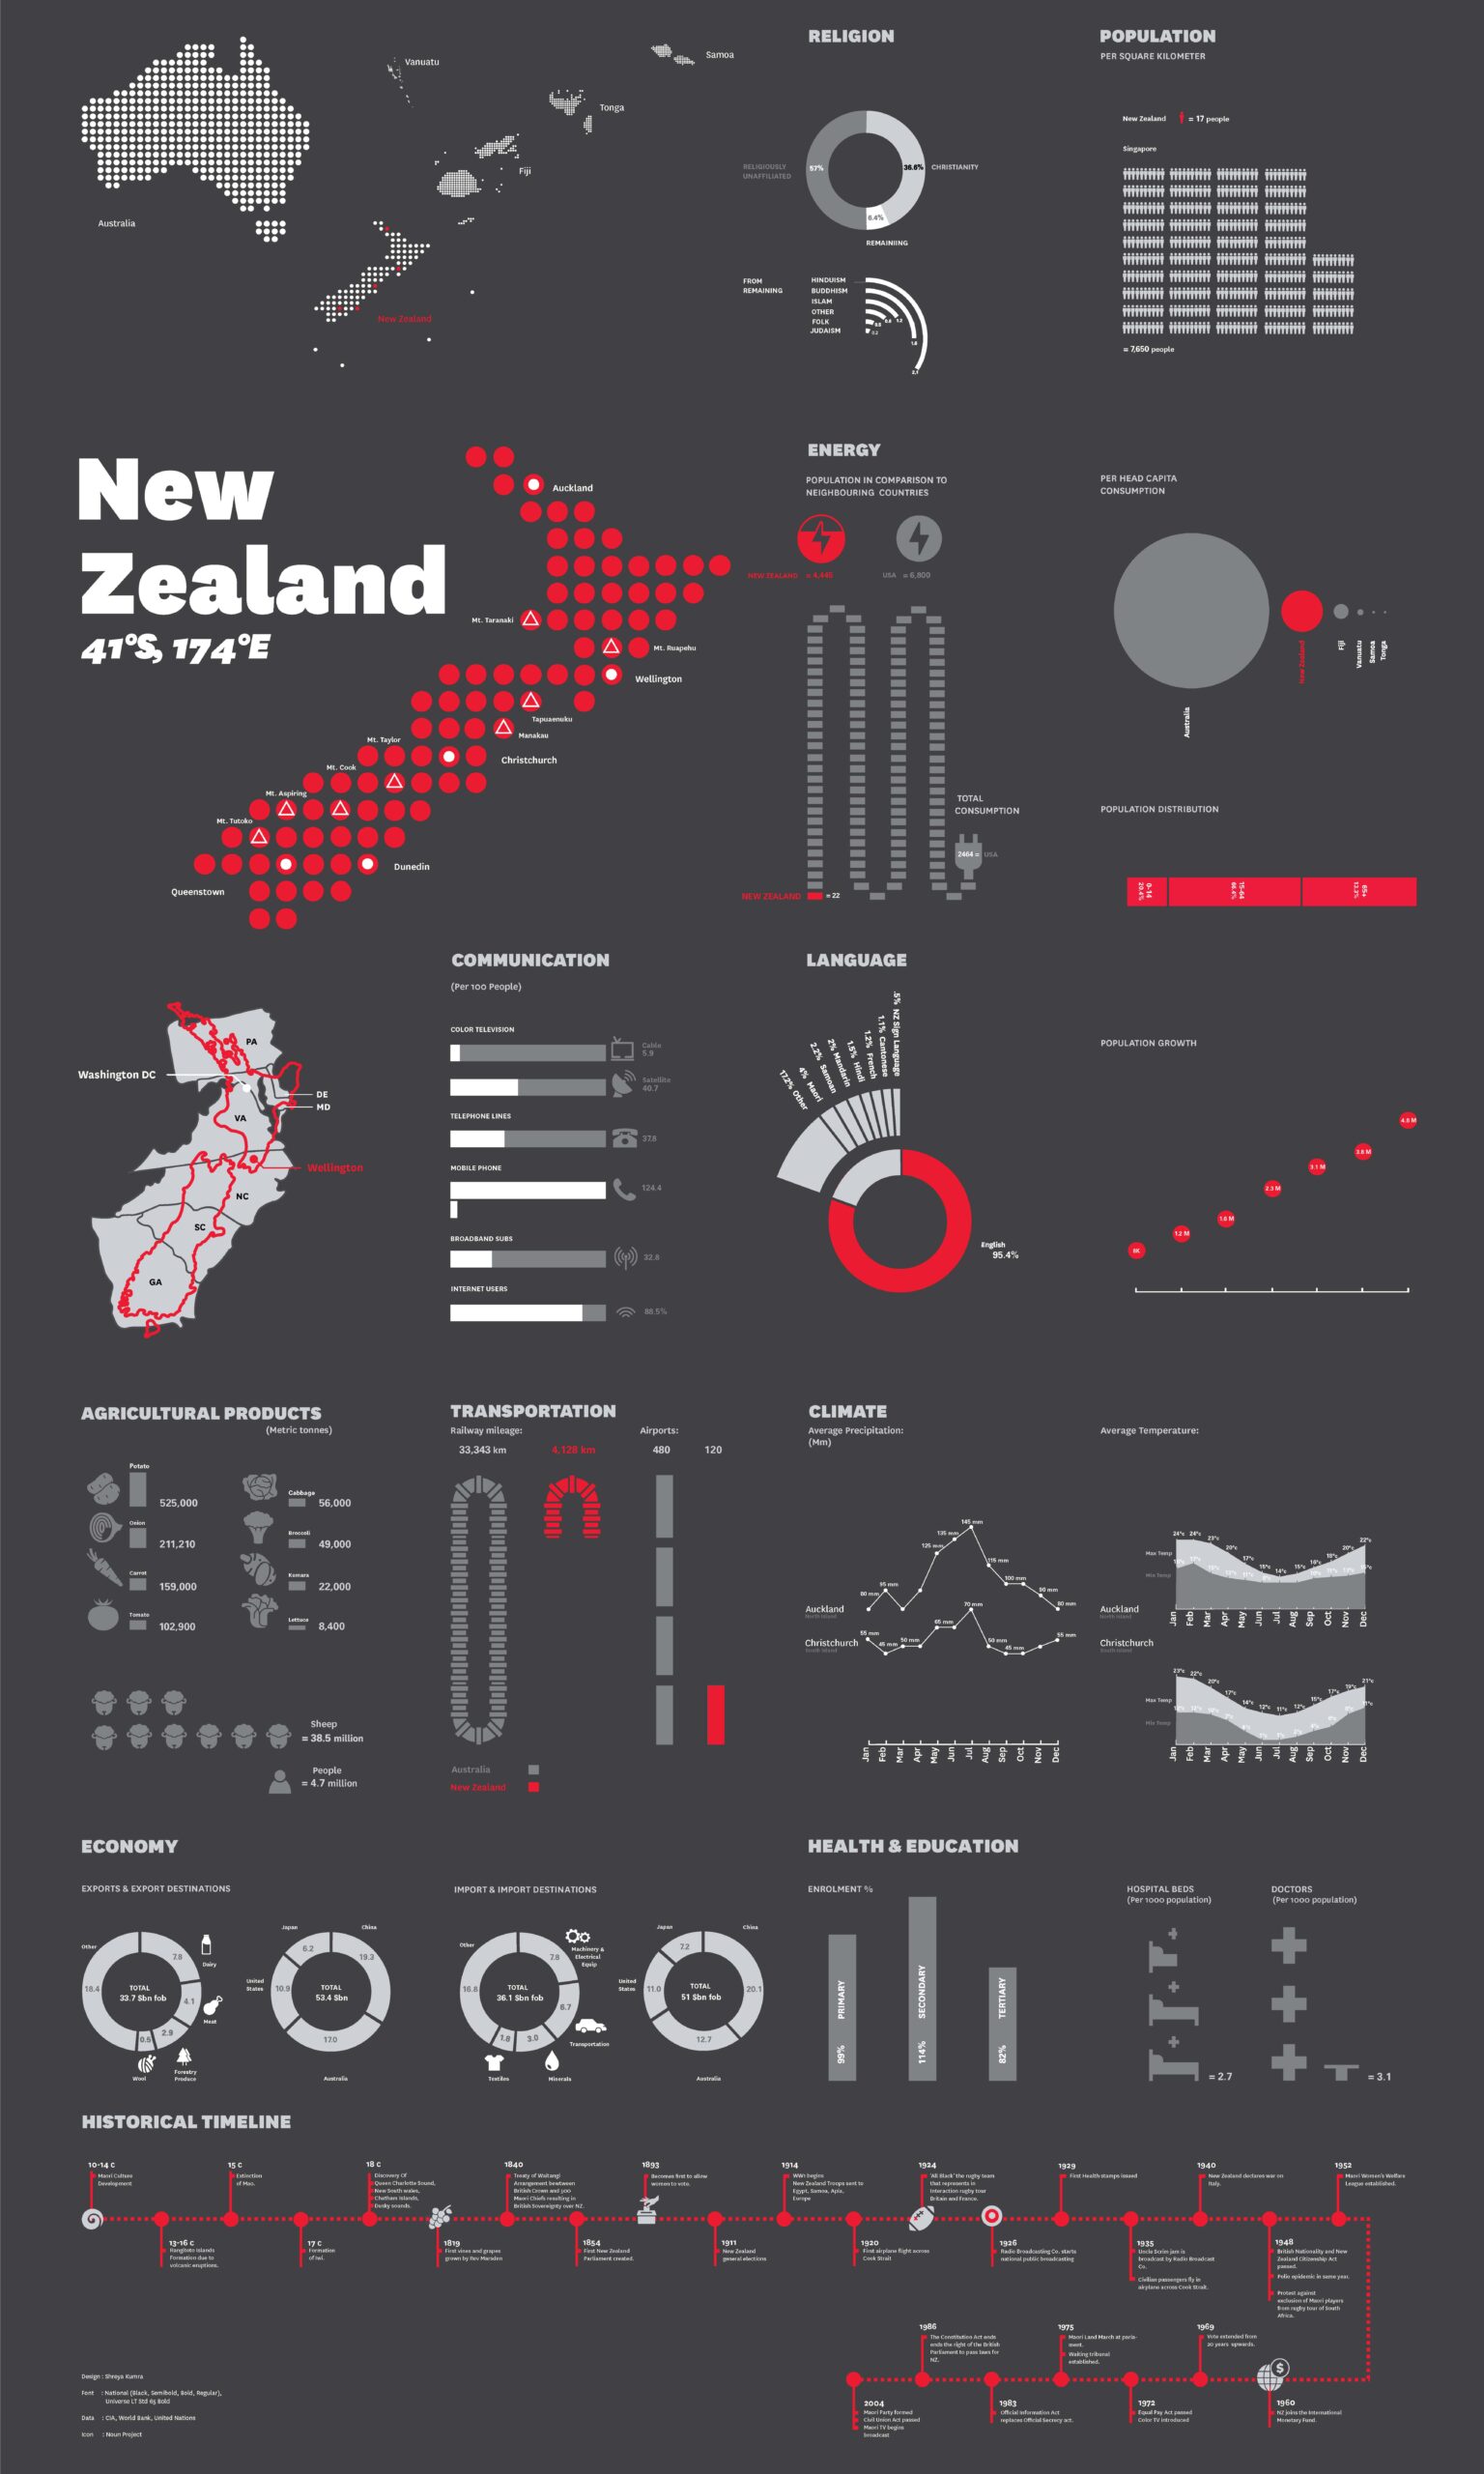
The New Zealand Project entailed the creation of a comprehensive country analytics and data visualization project. It involved the depiction of 31 different categories of anthropological, infrastructure, and business data about the country in absolute and percentage terms, ranging from ethnic groups to export destinations, airports, and railway miles, in relation to a country of comparative size in one visual template.
Through this project, I aimed to showcase the organizational and analytical capabilities of country analytics and data visualization. By using complex information structures and visual systems of form, color, and typography, I was challenged to present complex information through the use of different maps, graphs, and diagrams.
For this project, I drew inspiration from renowned information architects such as Nicholas Felton, William Playfair, and Charles Joseph Minard.