BON VOYAGE3
Data Visualisation
Journey Mapping
Duration / 3 Weeks
Mentor / RISD Graphic Design, Doug Scott
Tools / Adobe Illustrator
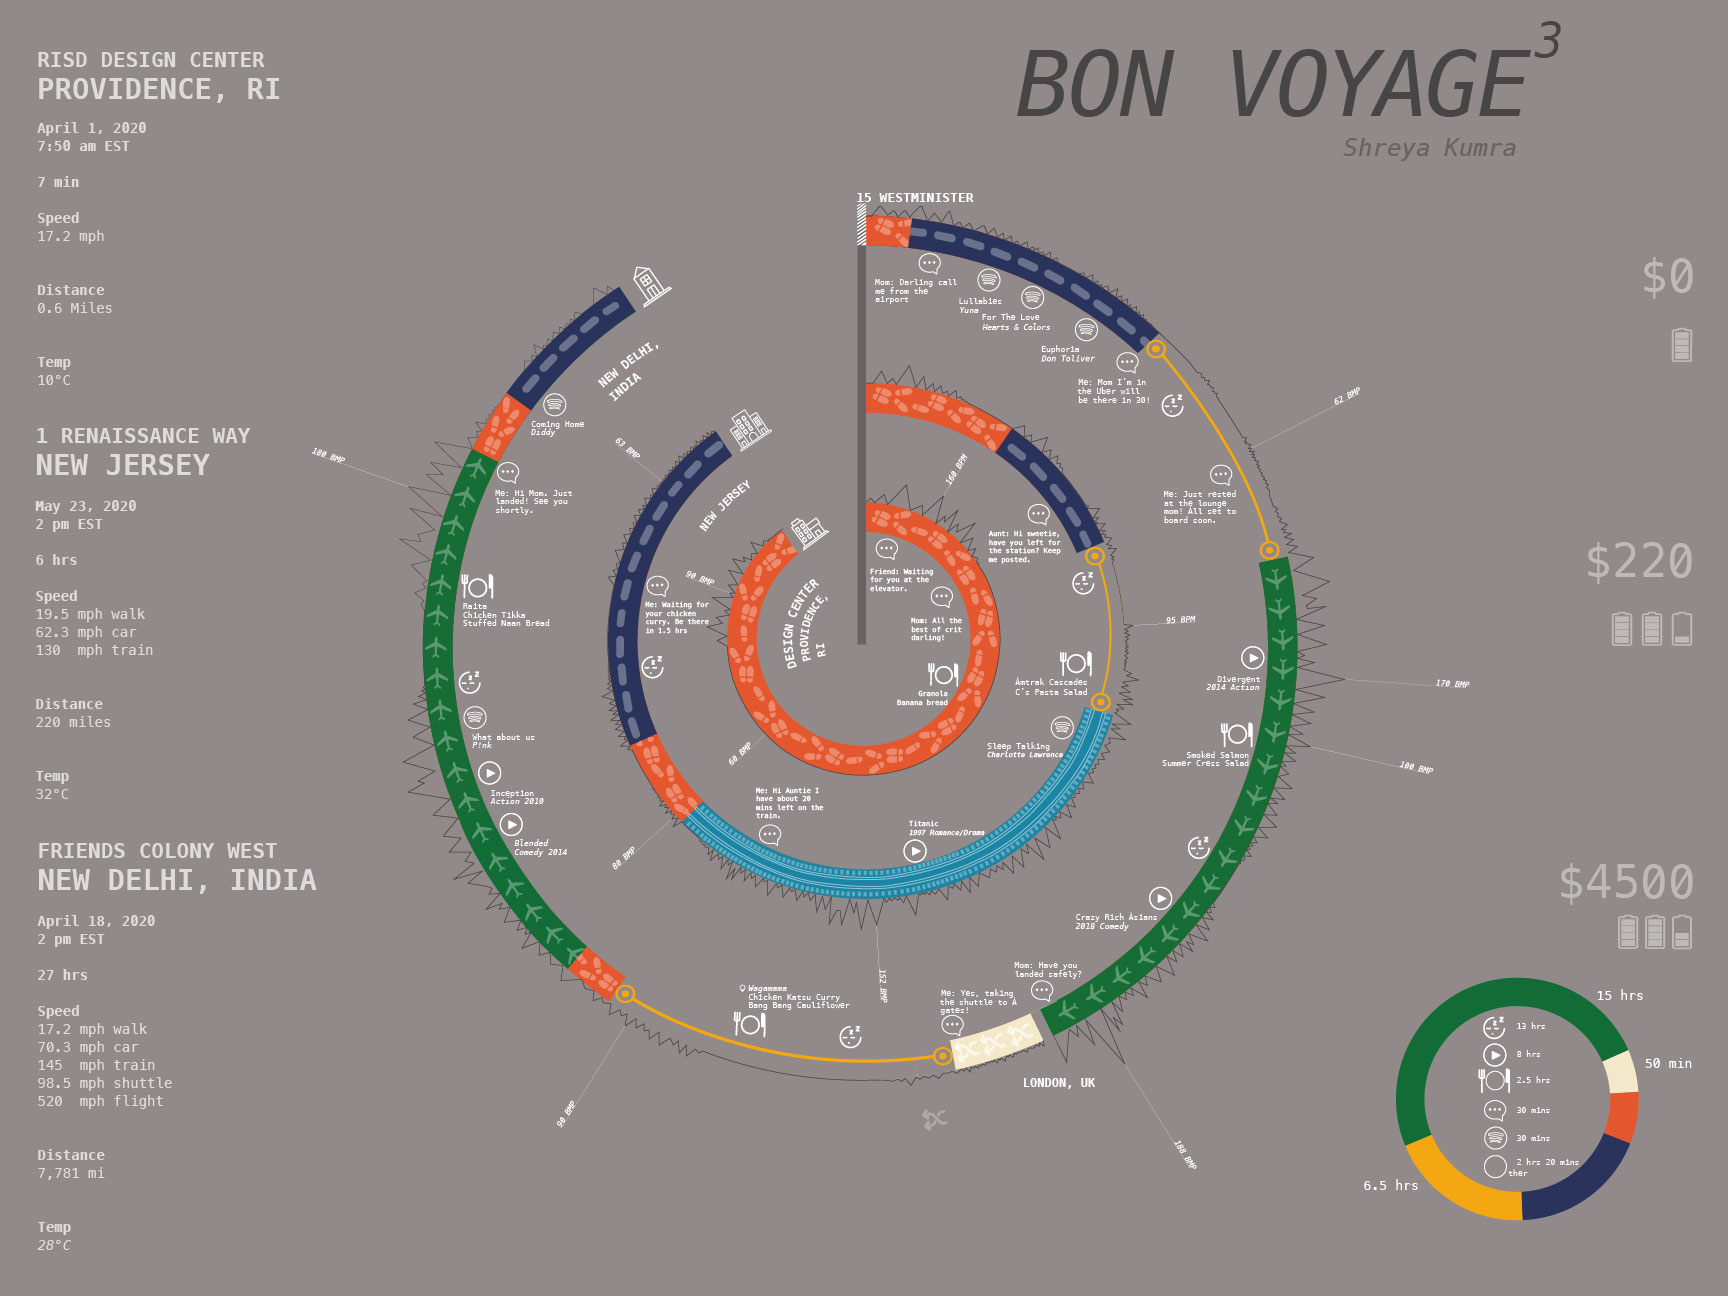
As part of the Bon Voyage3 project, I created a comprehensive and engaging journey mapping visualization. The visualization includes 15 different data sets collected on three unique trips, each with its own distinct set of personal experiences.
The datasets consist of information such as date, time of journey, distance, temperature, speed, modes of transportation, social media activities, music listened, the amount of money spent, food eaten, fluctuation of my heart rate throughout the journey, and more. Additionally, the overseas journey to New Delhi, India, features a visualization of how all my time was used, including a breakdown of time spent on each activity compared to the total journey time.